Basic Instructions From The Guide For Four Hour Trader
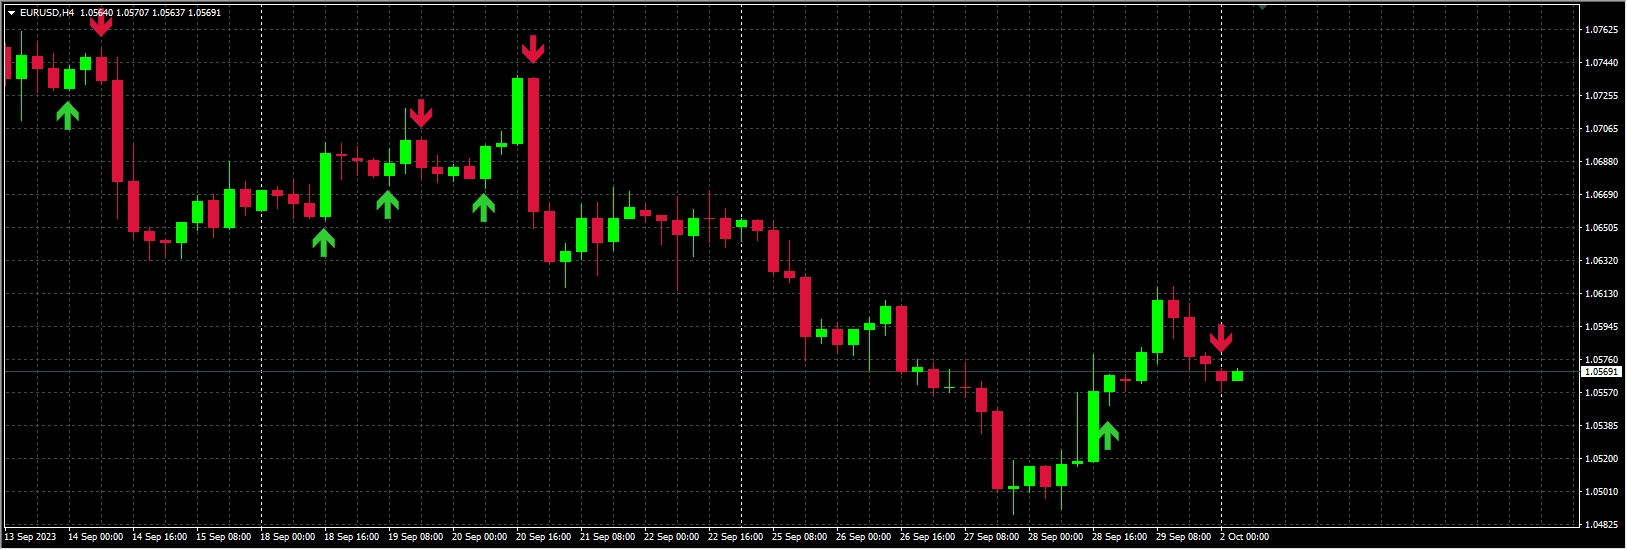
Using the SaneFX indicator without the TCCI, we simply leave our MT4 running with the four main charts (oil, gold the Dow (either Dow futures or the YM e-mini Dow) and the EUR/USD open – obviously set to the 4 hour period – and wait until we get a signal arrow. With only an average of 8 or 9 signals a week, there is no point in sitting by the screen! In fact, it is possible to turn MetaTrader off and just do quick check every four hours. If your MT4 starts 4hr candles at 00:00, 04:00, 08:00, 12:00, 16:00 and 20:00 you need only check a few minutes before each of these times (if you are available) and if no signal appears by the start of the next candle (they can appear at any time during the 4 hour life of a candle), then relax and come back in another four hours.
If there is a signal arrow, then we open a trade in the direction of that arrow at the start of the next candle – not before. Don’t think you’re being clever by jumping the gun and placing the trade immediately the signal appears because the price may retrace and the signal disappear before the end of the candle. So, green arrow, we buy; red arrow we sell.
Once the trade is open, put in a stop (60 pips down from your open price for a buy or 60 pips up from a sell) and a take profit of +100 pips in the other direction. this is for the EUR/USD. Now, we use our special method of opening two trades with gold, the Dow and oil.
The best way to do this is to literally open two trades, one after the other and set the first one to +100, the second to +200 but both with a -70 pip stop. When the first one gets closed (assuming it was in profit), move the stop up to break even on the remaining trade. The complication with this is that the open prices will usually be slightly different but that doesn’t matter…
In this way, we lock in 100 pips and stand to gain another +100 pips or lose nothing. You may prefer to move the stop to +10 or a little higher, just to get something! As a point of interest, if you right click on the trade number in the terminal window and click on ‘Profit’ and then ‘As points’ it will display not only your money on the trade as plus or minus but also the number of pips. You can open just one trade with a take profit +200 pips but the problem here is that you’d have to manually close half the trade when it reaches +100 pips.
Talking of pips, we have some complications with Forex and gold. Most brokers show an additional decimal place (5 with the EUR/USD) so we must be careful to put in stops and take profits as –700 and +1000. The same applies to gold with the price being shown to one cent when a pip is 10 cents! Again, depending on your broker, oil may have another decimal place. The way to tell is to press F9 and see if the last digit displayed in the prices is a small one – if it is, you need to input stops and take profits with an extra zero on the end! You can also tell by the spread (difference between buy and sell prices) because if it is, say 50 for gold, then obviously that means really a 5 pip spread (or we’d be in deep trouble).
Once you trade is placed, you can check back occasionally to see how it’s doing and, when the +100 is reached, take appropriate action – unless it is a EUR/USD trade. Below is a summary of trade parameters.
Gold: Stop –70, 1st contract +100, 2nd contract +200 move stop to B/E
Dow: Stop –70, 1st contract +100, 2nd contract +200 move stop to B/E
Oil: Stop –70, 1st contract +100, 2nd contract +200 move stop to B/E (needs the specific oil indicator)
EUR/USD – Stop –60, Take profit +100 (other pairs may differ)
The only other parameter to consider is the size of the signal candle (from tip of the tail to top of the wick) because an extra large candle means that something unusual has happened and chances are that it’s best not to trade (violent price changes are often followed by either a retrace or a long period of going sideways). Below are the recommended maximum candle sizes above which it is not recommended to trade.
Gold – 200 pips (a $20 price move)
Dow – 150 pips
EUR/USD – 150 pipsOil – no maximum but use your common sense.
That’s the basics of trading but there are times when it’s better to bend the rules but only do this when you become experienced. One are that can cause complications is that of financial news releases that effect the USD and hence all the main instruments we trade. As a general rule, the four-hour chart is less troubled by news releases that can cause wild movements on the 30-minute charts. This means that they can be mostly ignored.
The other problem that effects all trading is that of sideways movement – when the price is just drifting up and down within a narrow range (usually well under 100 pips) and so results in a string of buy and sell signals that go nowhere. I would define sideways movement as being when we have at least six candles that overlap each other. In our case, this would be at least a whole day with no up or down trend evident. Again, using the four-hour charts, this is less of a problem and, of course, we can never know when it starts or ends. For this reason, it is best to take every signal because, even if it is just going sideways, the next opposing arrow will close the trade for a relatively small loss and we always have the chance of a good breakout and some big profits.
An opposing signal always closes any trade and opens another in the opposite direct. For this reason, you should try and check you trades regularly in case this happens.
Be careful with contract sizes as you need to open two trades whereas before you were only opening one. This means basically half the normal size.
相关资源

暂无评论...


